What we learn together
The Numbers Behind Reliable Water Access: Inside Our Monthly Indicator Tracking
Reliability is one of The Water Project’s (TWP’s) core values, and functional water points are an integral part of a reliable WASH program. Over the years, TWP has built a portfolio of more than 2,700 water points with a vision of achieving complete water coverage in our focused geographic program areas within Kenya, Uganda, and Sierra Leone. The key to achieving water reliability is a robust Monitoring, Evaluation, Resolution, and Learning (MERL) process that allows us to see what is not working, to understand why, and to use the data to improve our program design and services.
Every month, the MERL team evaluates all of the functionality data collected through surveys submitted the previous month. “Functionality” essentially means that a water point is operating as intended. TWP’s implementing partners report functionality every time they conduct a survey or complete a repair.
How do we define functionality?
TWP determines functionality for each water point type based on a number of mWater survey questions, including whether water is available and whether any repairs are necessary.
For example, below is a simplified version of our functionality assessment for wells (boreholes and dug wells):
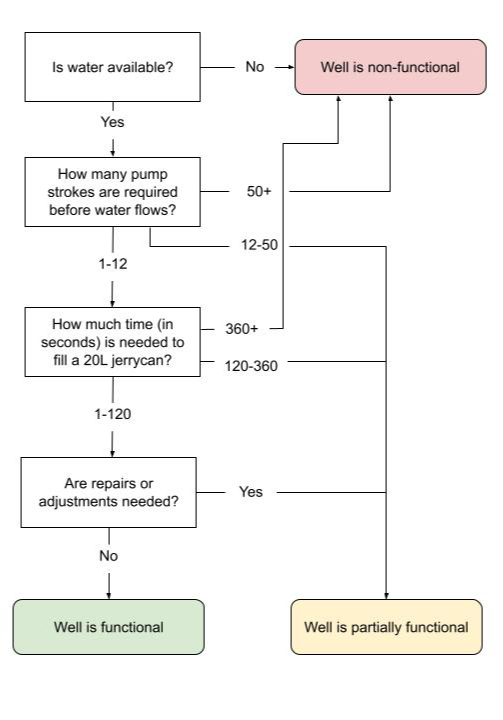
If we determine a water point is non-functional due to a mechanical breakdown, we aim to repair it within three days. This process also helps us identify water points that experience seasonal dryness, mitigate downtime for seasonal projects when possible, and improve design for future projects.
What do we calculate every month, and why?
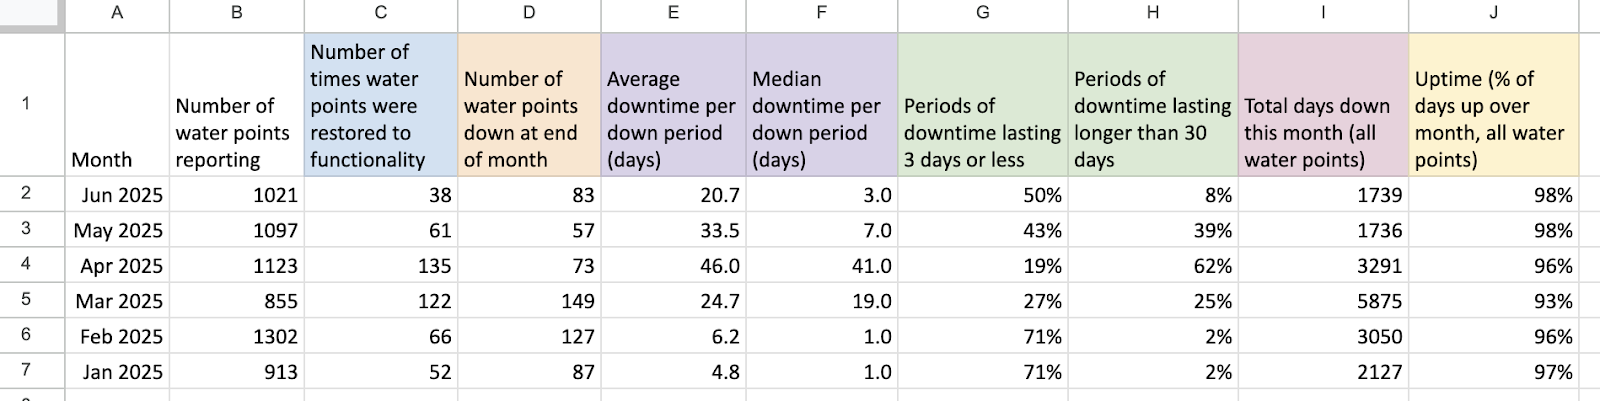
Across TWP’s portfolio of water points, we calculate a number of indicators related to functionality and downtime/uptime. These indicators are tracked in a spreadsheet (see image below).
Periods of time when a water point is non-functional (when it’s “down”) are called “downtime,” and periods when a water point is functional (when it’s “up”) are called “uptime.” We calculate these periods based on survey reports; when a survey is submitted with a report of non-functionality, the water point is considered “down” until another survey is submitted with a report of functionality, when we consider the water point back “up.”

We calculate these indicators every month for each program area and analyse the results:
What do we do with the data?
The purpose of collecting ongoing monitoring is to understand the causes of service disruption, to support the efforts of all team members to provide high-quality service, and ensure water point users have access to a reliable drinking water source. Part of that high-quality service is preventing or responding to service disruptions through Operations and Maintenance (O&M). Where possible, we practice preventative maintenance, which involves proactively replacing the parts that most frequently wear out. This prevents common breakdowns from occurring. Our O&M also includes rapid response to breakdowns, where our teams replace broken or worn parts or repair the water point structure.
Our monthly analysis of monitoring data helps us identify patterns in non-functionality, which we can use to ensure that our ongoing O&M programs are effective. Each calculation tells us something slightly different. For example, the median downtime per down period helps us quantify responsiveness, while the overall uptime helps us quantify the availability of water for all of the thousands of people served by TWP water points.
These monthly calculations help TWP track functionality over time and identify trends in functionality or non-functionality. For example, seasonal trends in non-functionality at rainwater tanks in Western Kenya helped us determine that, due to precipitation patterns, rainwater tanks weren’t serving as reliable water sources for schools year-round. This led to a programmatic change to prioritize higher-cost, higher-reliability water points for the schools to ensure year-round access.
We can also use the data to explore and celebrate successes (for example, our Western Kenya team had a median downtime of only one day per down period and had 99.4% uptime throughout June!). We can then use these results to investigate how the response teams achieve this uptime through preventing non-functionality and quickly responding when a water point does go down.
Home More Like ThisTweet