Making transparency easy, fast, and free
The Water Project has been sharing public, near-real-time water point functionality data on its website through bespoke API integration with mWater for many years now. Supporters, partners, and served communities have ready access to our entire water point directory with detailed reporting for each site that includes an mWater-powered historical record of each water point’s monitoring visits and results.
The Water Project and the Ugandan Water Project share a commitment to transparency within our work and to the strengthening of the entire water sector. These values manifest in our shared sponsorship of Embeddable Dashboards, a new feature on mWater, the cloud-based, open-access data platform both organizations use for tracking the impact of our programs in Sub-Saharan Africa.
The new Embeddable Dashboards enable mWater users to share interactive data directly to a website through easy-to-deploy embeds that automatically update as data collection occurs in the field. This capability is game-changing, making it easy, fast, and free to bring live data to all stakeholders.
“We believe this type of transparency is vital to move both supporters and communities toward an expectation of reliable uptime,” says Spencer Bogle, Program Director at The Water Project.
“We also know that our in-country teams take great pride in uptime and collaborate to seek parity in response times and results across their varied regions using this data as a benchmark.”
The Water Project chose to invest in this new mWater feature to lower the technical barriers of transparency for other water organizations.
“We believe sharing water point and functionality data, broadly and in near-real-time, moves the sector toward accountability that helps ensure long-term impact,” says Peter Chasse, Founder and President of The Water Project.
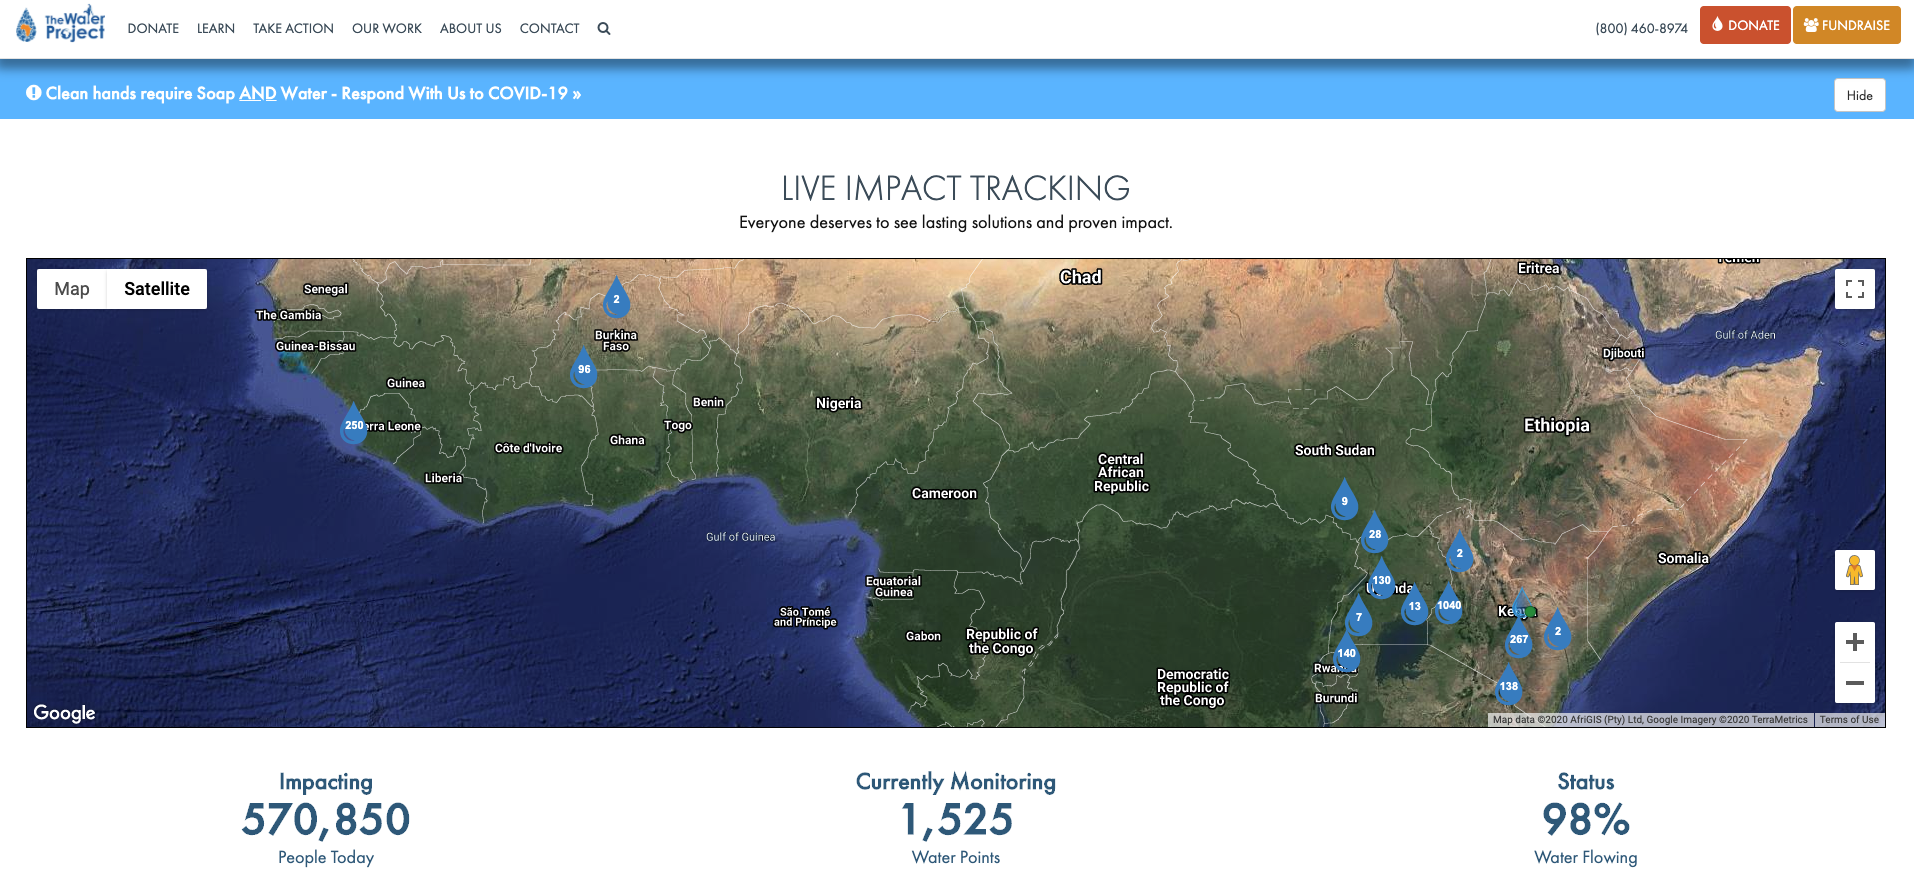
TWP’s live impact tracking map and mWater dashboard. Click the picture to interact with the data.
The Water Project will soon experiment with additional, live data visualizations on our website to invite supporters and the sector into our mWater monitoring data in even deeper ways. They are eager to see other organizations do the same, sparking collaboration and holding each other accountable for providing access to water that is proven reliable – every day.
The Water Project and Ugandan Water Project provide this resource with the hope that it will create and inspire valuable collaboration for the 75,000 mWater users in 180 countries fighting the global water crisis. James Harrington, Ugandan Water Project’s Executive Director, is enthusiastic about the new feature.
“This feature opens up tremendous opportunities, but our first priority is to share an interactive map of [our] water projects that allows anyone to visit our website and see all of the water projects we’ve implemented and their current functionality – that’s important because although everything was working the day a particular water point was installed, it matters more to know if that water point is working today.”
Both Uganda Water Project and The Water Project share the conviction that transparency plays a pivotal role in accomplishing the UN Sustainable Development Goal of providing safe and sustainably managed water for all. Embeddable Dashboards is one more step toward an open and honest display of what works, what doesn’t, how our sector learns from iteration, and what that means for communities in need of lasting, safe water.
This feature also empowers and provides greater impact evaluation access for those who fund WASH and seek to strengthen the flow of funding to organizations that demonstrate the most effective impact.
Home More Like ThisTweet
Tom Murphy
Tom is a Program Officer with The Water Project after working as a humanitarian journalist for 8 years. His work appeared in publications ranging from the Guardian to Foreign Policy to NPR, covering topics including water in India, agriculture in Kenya, public health in Haiti, and electricity access in Ghana.