What we learn together
The Journey of the Data on our Live Impact Tracking Dashboard
Today, you’ll come behind the scenes to learn how data appears on our Live Impact Reports page.
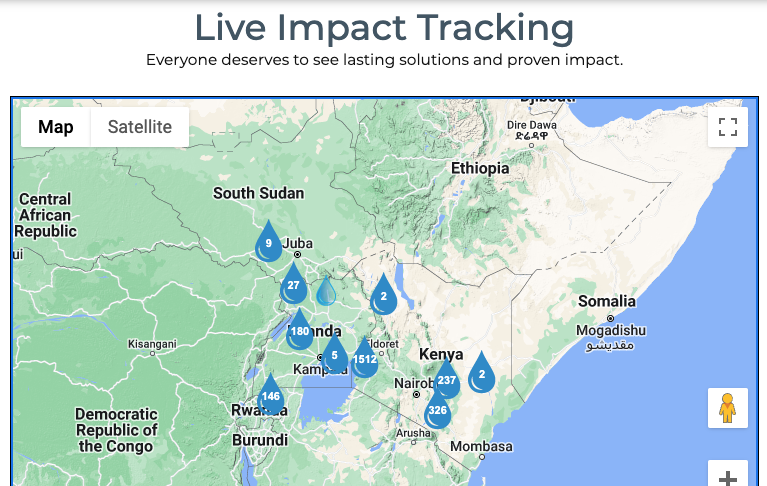
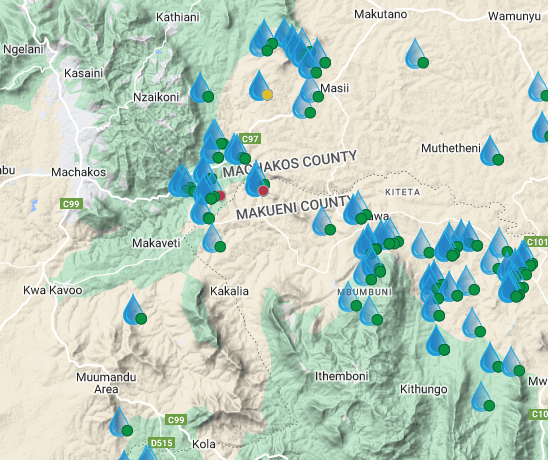
If you zoom in on the live map and find a water droplet accompanied by a green dot, the water at that point is clean and flowing. But if it’s yellow or red, you know our teams are diligently working to get that water source back up and running again.
When we first envisioned this way of monitoring each project’s status live on our website, we didn’t have a method to get there. But through years of trial, error, and careful planning, we’re proud to boast that our system works well — through the hard work of many individuals across our service areas.
How do we know when a water point has stopped functioning?
The first step is building a monitoring system. This is made much easier thanks to our water point management software, mWater, which helps us track issues and schedule visits. Each water point is logged into our system when we first start vetting a project for its viability — well before we even think about constructing it.
We track a project’s progress from a project proposal (when our in-country teams pitch a project idea and explain the community’s need) to the end of construction and beyond. We track each project by its GPS coordinates; this helps us maintain consistency across time and differentiate between water sources located in close proximity.
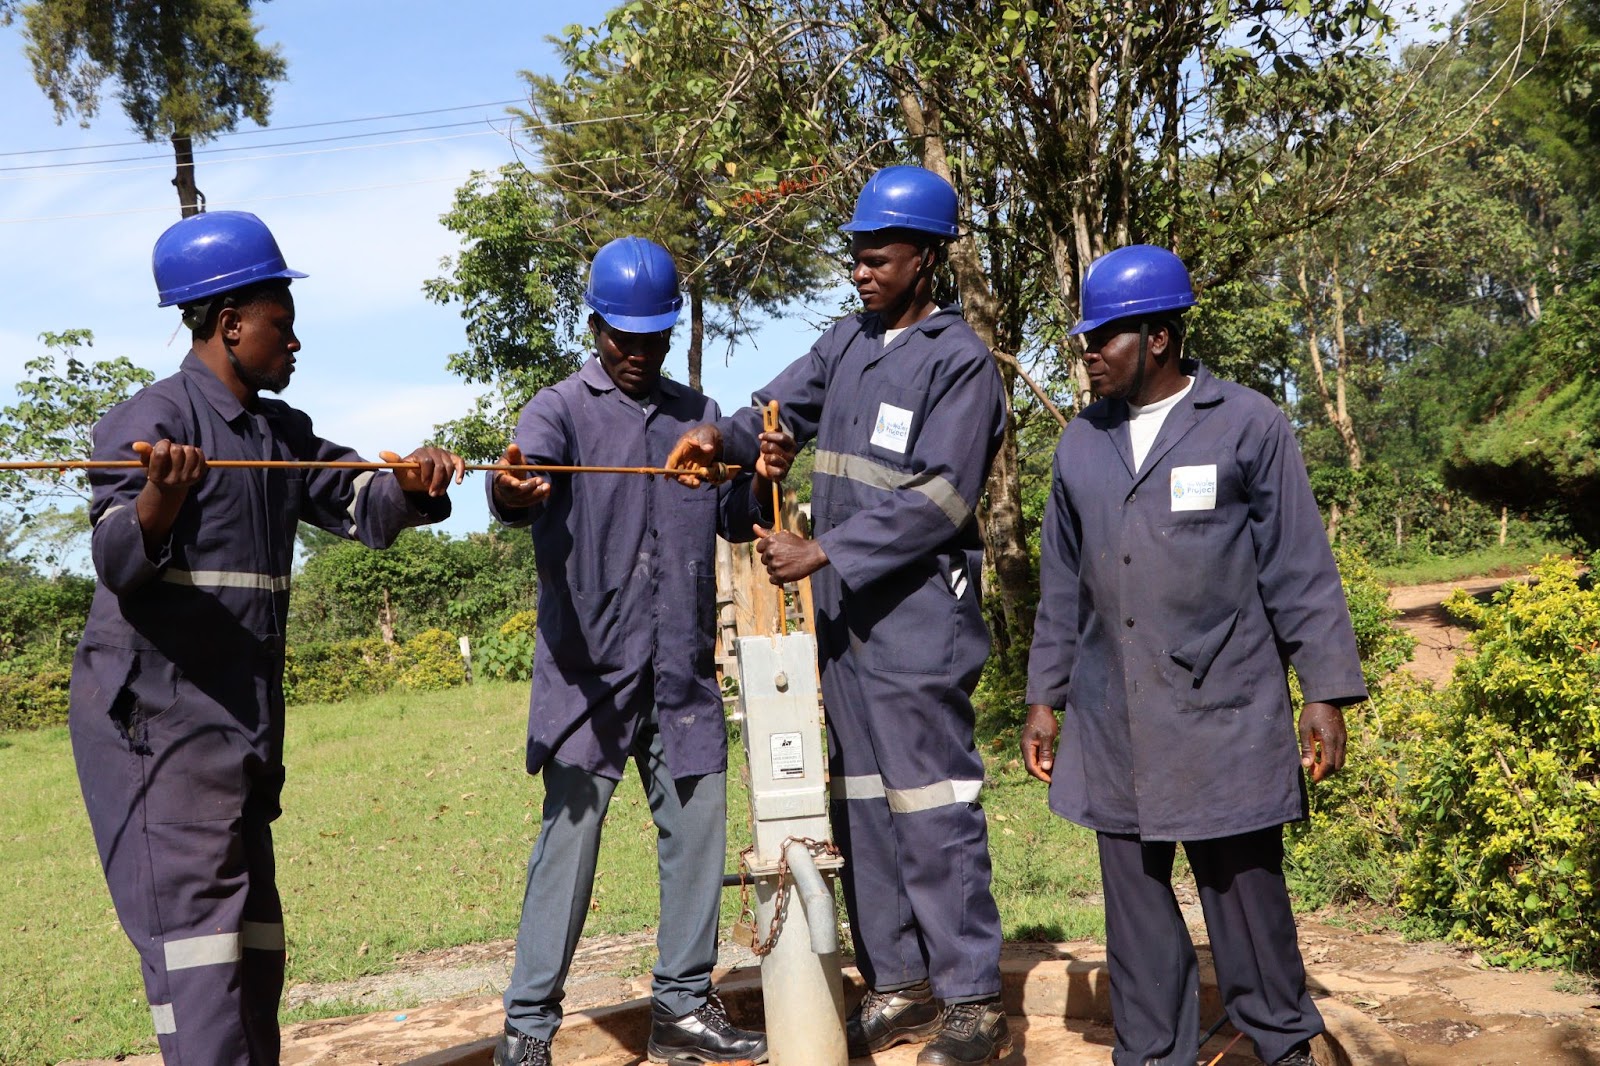
Our first monitoring check-up happens three months after a water point has been installed. Then, our technicians go back once per quarter — or anytime a community member calls to say something has gone wrong.
On a monitoring visit, our technician will log all the water point’s data on their phone, including whether water is flowing and how long it takes to fill a container of water.
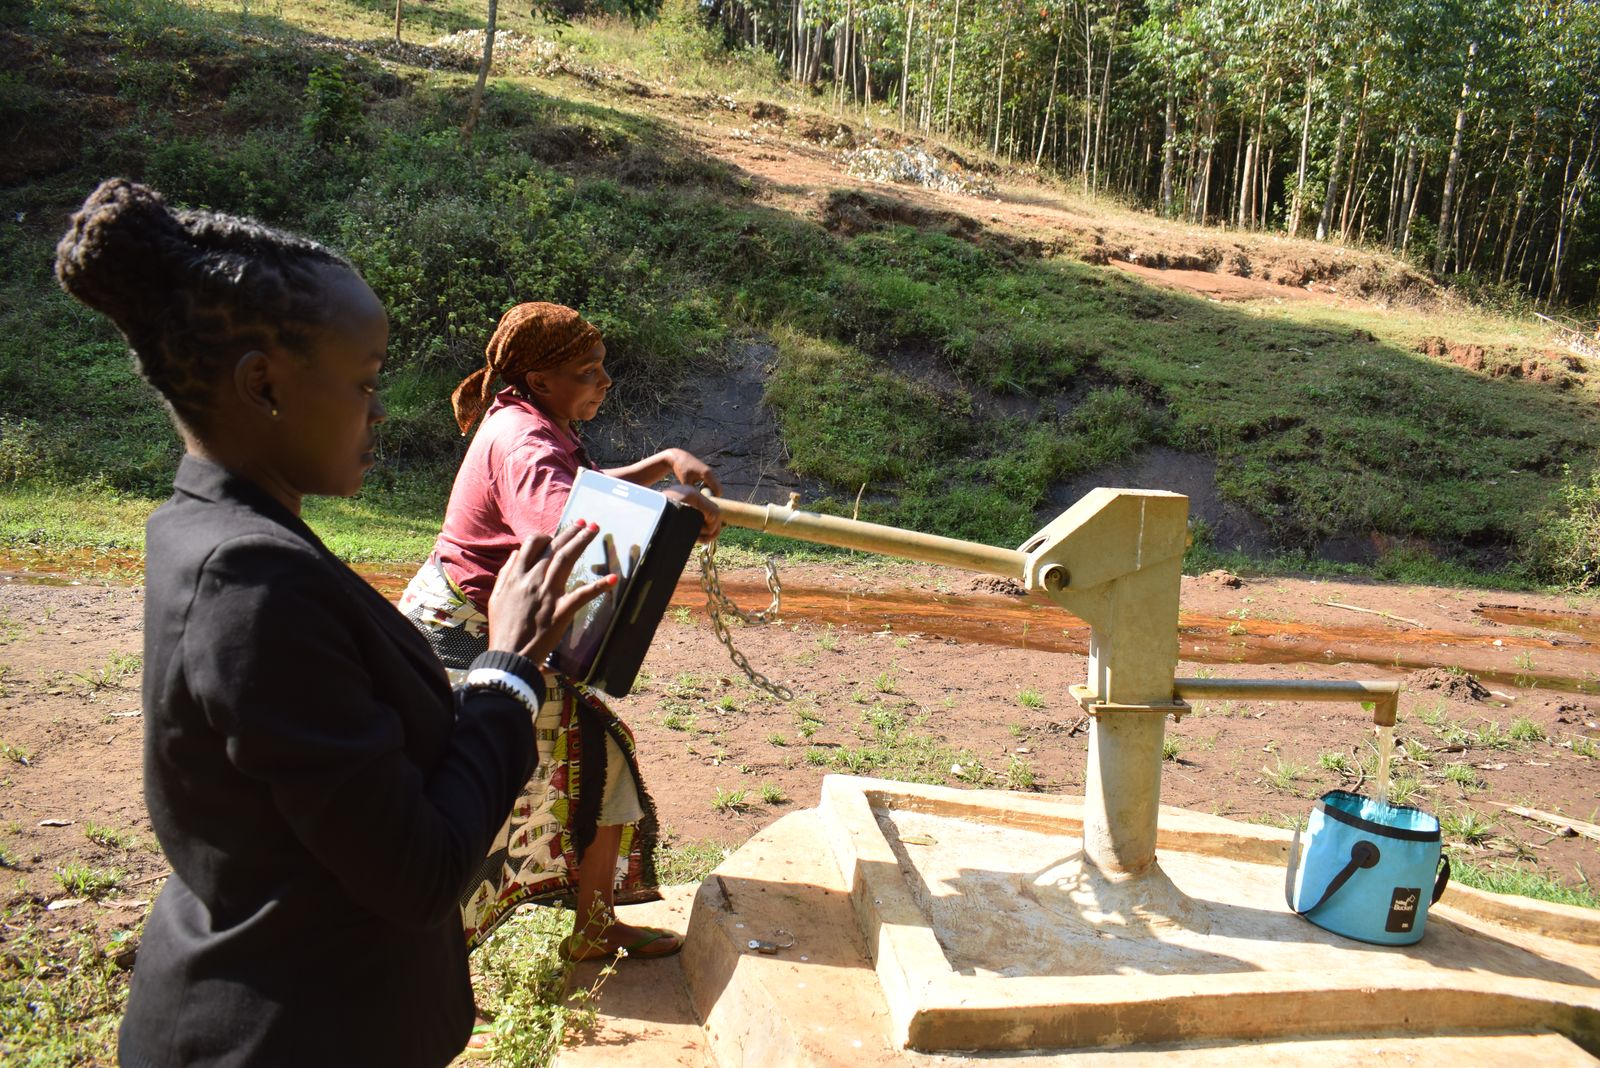
Our mWater software allows field techs to enter data while offline and then log it in once they return to a place with Wi-Fi. Rural sub-Saharan Africa isn’t exactly known for its robust mobile network!
During at least one monitoring visit per year, our staff member must interview a community member to establish how a water point is working for its community. For the other three quarterly visits, staff can evaluate the workings of the water source hardware themselves.
When a service outage occurs, in most cases, it’s the result of a mechanical breakdown, meaning a part of the hardware needs replacing. When this happens, a technician can replace the part while they’re at the site and mark the issue as resolved in our software. But if the problem can’t be resolved that day, they’ll come back as soon as possible.
In the majority of our service areas, our goal is to respond to all outages within 72 hours, but with the remote nature of some communities, this isn’t possible across every region — especially Southeast Kenya, where water points are so spread out that travel between them is nearly impossible. Regardless of the distance, all of our team members understand the urgency of reinstating clean water. Because many of our staff members have lived without reliable clean water themselves, they appreciate just how important it is.
mWater tracks how long it’s been since we’ve visited each water point, helping to ensure comprehensive and timely monitoring, and our teams map out their service visits accordingly. Fun fact: some teams like to visit water points in clusters, while others start at the farthest away point and slowly return to the office. And in sparsely populated Southeast Kenya, each sub-county has its own team to overcome geographic challenges and provide the same care we promise the other, less remote, communities where we work.
Once a waterpoint’s info is logged into mWater, our US-based monitoring staff performs quality control spot-checks on incoming data. If we find discrepancies, surveyors may need to make edits, and — in rare cases — they may need to return to the water point to ensure they report the correct information.
This data is displayed on each water project’s individual website page and the Live Impact Report page in a continent-wide view.
All this work means that donors like you can come back to our website anytime you like to check up on a project you helped build. It may seem like magic, but it’s actually a lot of work involving a lot of hardworking, dedicated people.
The donors who make all this possible are our monthly Water Promise members, who faithfully contribute monthly gifts ranging from $5 to $5000, depending on their means. They recognize how critical regular monitoring, evaluation, water quality testing, and data analysis are to the sustainability of each community’s safe, reliable water sources.
Home More Like ThisTweet
Jamie Heminway
Jamie is a storyteller by nature. In joining the Water Project, she’s finally found a workplace where that pesky bleeding heart of hers can be put to use (and, less importantly, that BA in English Language & Literature from New England College).